Instance Details Pane
The Instance Details pane displays instance data that includes the Job log file, the audits (timeline), and the resolved variables. This view is particularly useful when you’re working with a Job in a development or QA/Test environment. You can trigger the Job instance and then watch the results.
The Instance Details pane is updated as follows:
-
When you click on an instance (in Daily Activity, Operations, Gantt, Instances pane, etc.), you will see the currently selected instance’s information in the Instance Details pane.
-
When you click on a Job template (i.e. Job object definition) in the Object Navigation pane, you will see the details for the last completed instance in the Instance Details pane.
Three (3) vertical tabs control the details of what you can view: Log Viewer, Instance Timeline and Variables (outlined in red below).
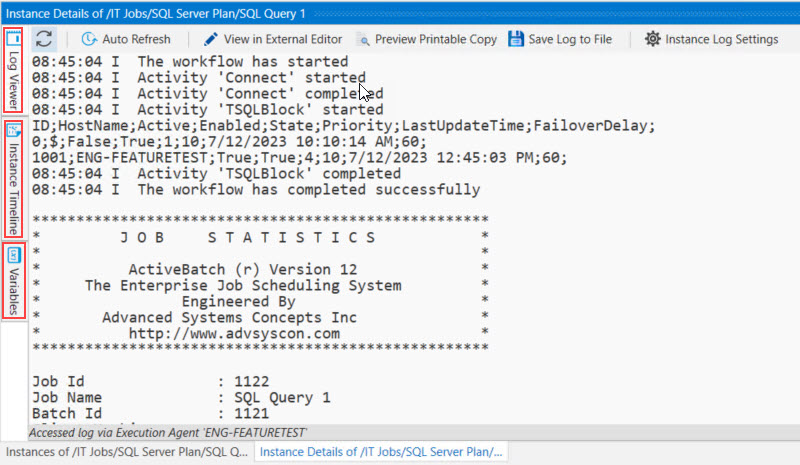
Log Viewer controls your view of the instance's Job log file. Log Viewer is the tab enabled by default, and is what you see in the above image. By default, the contents displayed are a standard log file.
There are (6) Log Viewer toolbar buttons. They are described below, from left to right.
-
Refresh - The system refreshes the log file with new output, if any.
-
Auto Refresh - When enabled (the button's background is blue), you can observe the Job log output in real-time. You can disable the Auto Refresh button (click on it to toggle it off - the blue background is removed) if you would prefer to control that aspect, and then use the manual Refresh button.
-
View in External Editor - This option pulls up the Job log file in the default editor (e.g. Notepad).
-
Preview Printable Copy - This option displays the log file in the default web browser. The web browser's print option can be used, if desired.
-
Save Log to File - This option pulls up a Windows Save Log File dialog, allowing you to save the log with a name and location of your choosing.
-
Instance Log Settings - This option pulls up the Tools > Settings > Views > Instances Log configuration settings.
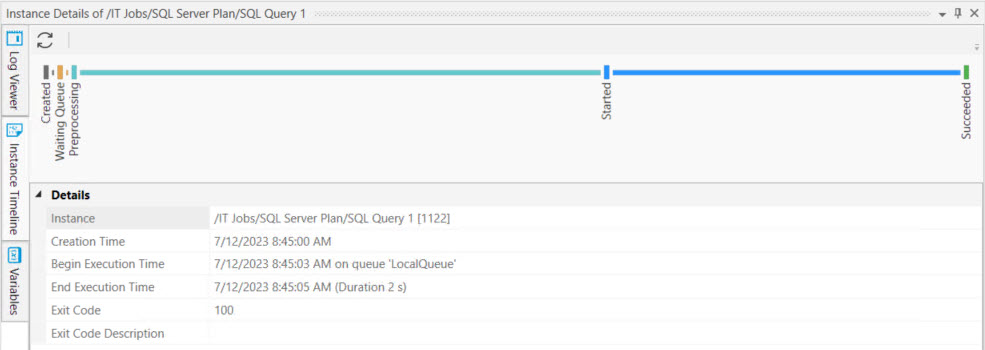
Instance Timeline (see the image below) controls your view of the various states of the instance (including when the instance is still executing) by time. You can hover over a state to gain insight into the time spent. The graph depicts the audits of the instance by time. Observe the labels in the graph - "Created", "Waiting Queue", "Preprocessing", "Started" and "Succeeded". They are all instance audits.
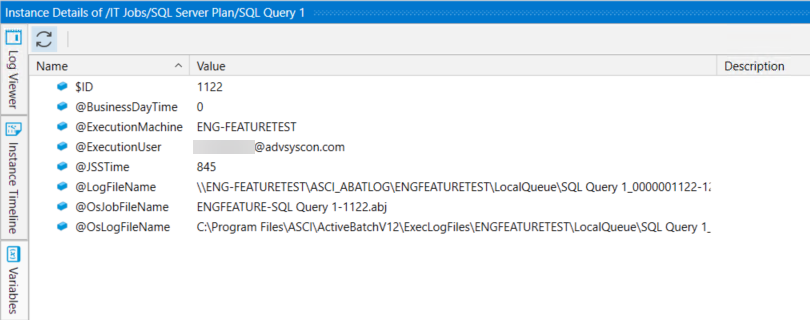
Variables displays how the instance's variables resolved, as per the image below. You will see the variable name, and its value.