Using the ActiveBatch Dashboard
The ActiveBatch Dashboard is a stand-alone utility program that provides a user interface for graphing ActiveBatch performance and Job Scheduler health.
Dashboard Framework
The ActiveBatch Dashboard consists of at least one (1) dashboard element and one (1) dashboard graph or widget. The purpose of the dashboard is to layout one or more graphs for a specific purpose. By supporting more than one dashboard you can switch between different types of information that might suit the role of one person versus another.
When you initially start the ActiveBatch Dashboard utility, an empty dashboard is created. You then decide which graph and ActiveBatch counters you want to add to the dashboard. Presently four (4) graphing elements are available: Line, Bar, Pie and Job Scheduler Health. The Job Scheduler Health is a special type of graph element which we’ll discuss later.
Counters
To select a graph click on the “Add Graph…” button and you will be presented with a list of the graphs currently available for selection. Let’s assume you select Line Graph. The dialog below will be presented.
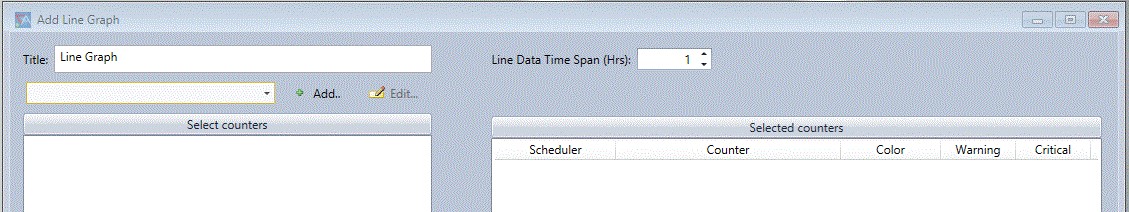
The information for graphing is similar regardless of which graph element you choose and can best be broken down into the following categories: Graph Attributes, Job Scheduler connection information and which counters you select for your graph.
Graph Attributes consist of the Title of the graph and any special characteristics unique to the graph. A Line Graph incorporates a time aspect as the “x” axis so the characteristic “Line Data Time Span” allows you to select how long the time window will be when graphing your counters. By default, a one (1) hour time window is established.
Job Scheduler connection information allows you to specify which Job Scheduler you want to connect to and request counters information from.

If the Job Scheduler is already connection, simply click on the dropdown handle to see the currently connected schedulers. To add a new Job Scheduler connection, click the “Add” button.
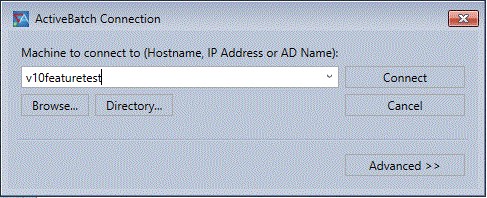
The above dialog will then appear. You have several methods for specifying the Job Scheduler you want to connect to. You can type in the hostname, IP address or AD name. You can Browse your Network connections. You can retrieve the ActiveBatch Directory of published Job Scheduler (through Active Directory) and select the scheduler you desire. Finally, if you need to specify different security credentials you can click on the “Advanced>>” connection button and specify alternate credentials. By default, your logon Windows credentials are used. Once you connect to a scheduler the “Select Counters” column will contain counter information that is similar to what is shown below.
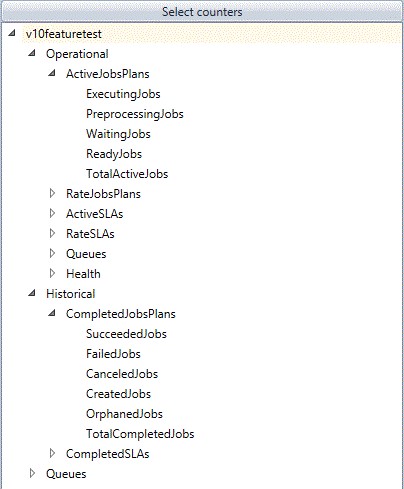
ActiveBatch provides two (2) types of counters: Operational and Historical. Operational counters are those which reflect the actual number of the counter. Operational counters can therefore go up or down. Historical counters are those which are only incremented. Clicking on a sub-category will reveal the underlining counters. For example, ActiveJobsPlans\ExecutingJobs is an operational counter that indicates the actual number of active Jobs running on a scheduler at that moment in time. CompletedJobsPlans\SucceededJobs is an historical counter that indicates the total number of Jobs which succeeded. This counter can only go up. Some counters are therefore best suited to certain graph types than other counters. Historical counters won’t work well with time based graphs.
You may notice the sub-category RateJobsPlans. This sub-category consists of historical-based counters that have been transformed to rate based values. This means those counters will go up and down. For example, JobsSuccessRate provides a value which tracks the number of Jobs which complete successfully within a polling interval.
You may notice the “Queues” counter at the bottom of the above image. Clicking on that subcategory will display all the Queues that reside on your scheduler. This allows you to graph individual Queue statistics in much the same operational and historical counter perspective.
The tables which follow provide more information for each sub-category and counter. Operational and then Historical counters are presented.
| Counters | Description |
|---|---|
|
ExecutingJobs |
Number of executing Jobs. |
|
PreprocessingJobs |
The preprocessing state includes variable resolution as well as the initial dispatch of the Job to the Execution machine. Once the dispatch has been successfully acknowledged, the Job’s state is changed to executing. |
|
WaitingJobs |
Number of waiting Jobs (this counts all waiting Jobs regardless of the reason for waiting, for example, waiting queue busy or waiting active). |
|
ReadyJobs |
The Ready state means the Job is eligible for possible execution. |
|
TotalActiveJobs |
This counter totals ExecutingJobs, PreprocessingJobs, WaitingJobs and ReadyJobs. |
The above table represents the Active Jobs and Plans set of counters. The counters include Plans where applicable.
| Counters | Description |
|---|---|
|
JobsSuccessRate |
Rate at which Jobs complete successfully. |
|
JobsFailureRate |
Rate at which Jobs complete in failure. |
|
JobsCancellationRate |
Rate at which Jobs are cancelled/aborted. |
|
JobsOrphanRate |
Rate at which Jobs are orphaned (dispatched for execution but whose status is now unknown because execution service was restarted and can’t determine active state of Job). |
|
JobsCreationRate |
Rate at which Jobs are created or instantiated. |
The above table represents the Rate of Completed Jobs and Plans. These counters aren’t really present within ActiveBatch but represent the “delta” or “rate” between the last set of values for their historical counter representatives based on the polling interval.
| Counters | Description |
|---|---|
|
ExecutingSlaJobs |
Number of executing Jobs marked for SLA. |
|
BreachedActiveSlaJobs |
Number of Jobs marked for SLA which have breached their SLA deadline. |
|
WarningSlaJobs |
Number of Jobs marked for SLA which have triggered a warning SLA alert. |
|
CriticalSlaJobs |
Number of Jobs marked for SLA which have triggered a critical SLA alert. |
|
TotalActiveSlaJobs |
This counter totals ExecutingSlaJobs, BreachedActiveSlaJobs, WarningSlaJobs and CriticalSlaJobs. |
The above table represents the active objects that are marked as SLA-sensitive. This includes both Jobs and Plans.
| Counters | Description |
|---|---|
|
SlaJobsSuccessRate |
Rate at which SLA marked Jobs complete successfully. |
|
SlaJobsFailureRate |
Rate at which SLA marked Jobs complete in failure. |
|
SlaJobsAbortRate |
Rate at which SLA marked Jobs are cancelled/aborted. |
|
SlaJobsBreachRate |
Rate at which SLA marked Jobs have breached. |
The above table represents the Rate of Completed SLA Jobs and Plans. These counters aren’t really present within ActiveBatch but represent the “delta” or “rate” between the last set of values for their historical counters based on the polling interval.
| Counters | Description |
|---|---|
|
StartedQueues |
Number of Queues in started state. |
|
StartingQueues |
Number of Queues in starting state. |
|
StoppedQueues |
Number of Queues in stopped state. |
The above table represents the counters for all Queues within the ActiveBatch scheduler. Note that a Starting state, unless transient, isn’t a good indication of a healthy Queue.
| Counters | Description |
|---|---|
|
HealthStatus |
A value from zero (0) to ten (10) where zero indicates the lowest (worst) health of the JSS and ten indicates the highest (best) state of the JSS. |
|
HealthStatusRate |
The counter ‘HealthStatus’ expressed as a rate (delta) which can indicate a worsening or improving trend for JSS health. |
The above table represents a numeric value from zero to ten which represents the health of the Job Scheduler.
The tables which follow represent the historical counters. These counters only go up until they are reset.
| Counters | Description |
|---|---|
|
SucceededJobs |
Total number of succeeded Jobs. |
|
FailedJobs |
Total number of failed Jobs. |
|
CanceledJobs |
Total number of cancelled Jobs. |
|
CreatedJobs |
Total number of created or instantiated Jobs. |
|
OrphanedJobs |
Total number of orphaned Jobs. |
|
TotalCompletedJobs |
Total number of succeeded, failed and canceled Jobs. |
The above table represents the historical counters for mostly completed Jobs and Plans.
| Counters | Description |
|---|---|
|
SucceededSlaJobs |
Total Number of successful Jobs marked for SLA. |
|
FailedSlaJobs |
Total number of failed Jobs marked for SLA. |
|
AbortedSlaJobs |
Total number of aborted/cancelled Jobs marked for SLA. |
|
BreachedSlaJobs |
Total number of breached Jobs marked for SLA. |
|
TotalCompletedSlaJobs |
This counter totals SucceededSlaJobs, BreachedSlaJobs and FailedSlaJobs. |
The above table represents the historical counters for completed Jobs and Plans marked for SLA.
Selecting Counters
As noted, some counters are applicable to certain graphs. The Line graph is a time based graph. This means that operational counters are best suited for this graph. Likewise, a pie chart is best suited for historical counters.
When you decide on the counters you want to track, simply select them right arrow indicator to move the counter into the right side “Selected Counters” column. Likewise, select a Selected Counter and use the left arrow indicator to remove the counter.
As you move each counter to the Selected Counters column, a color will be assigned to the counter. You can change the color by clicking on the color’s dropdown handle.
Daily vs. Aggregate Counters
In the preceding sections we discussed all of the various counters and the types of counters which are available. We also learned about Operational and Historical counters. For Historical counters you can choose between Daily and Aggregate. The Daily set of historical counters represents counter values for the current business day (the default time begins at midnight and if not changed means the business day is the same as the calendar day). By default, Daily is shown. Aggregate represents the set of historical counters since they have been manually reset.
So if you are interested in seeing the number of Jobs which succeeded today as opposed to ever succeeded you will want to ensure that Daily is specified. The lower right hand edge of the Dashboard indicates whether Daily Counter or Aggregate counters are used. Once again, this only applies to the Historical type of counters. Operational counters indicate the current state they are tracking (i.e. executing).
Assigning Alerts to Counters
You’ll notice that 2 columns are present within the Selected Columns area that are noted as Warning and Critical. These columns allow you to optionally specify a non-zero value which represents a warning or critical value for that counter. When a warning or critical value is reached it is noted in a special alerts area. We will discuss that area in a later section of this chapter. Please note that the use of the word “alert” is meant generically and is not related to the ActiveBatch Alerts object.
Only Operational counters are provided with an alert capability. A value of zero (0) means that no alert for that level is to be engaged.
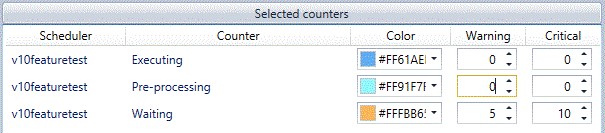
In the above figure, the Waiting counter is requesting alerts for a warning level set at 5 and a critical level set at 10. Please note that the terms warning and critical are not meant to overly convey a sense of foreboding. We could have labeled them as Alert#1 and Alert#2.
When all selected counter(s) have been specified, click the OK button to apply your counters and graph element to the dashboard.
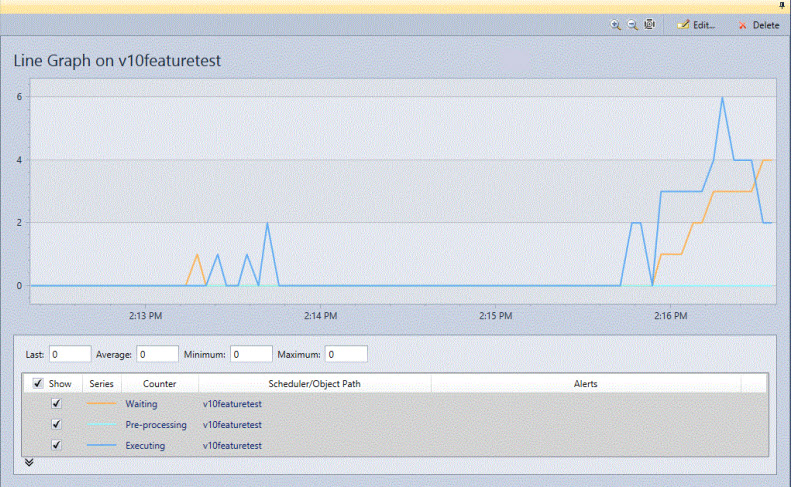
The above figure is a sample Line graph. The “x” axis is the time and the “y” axis represents the values of the counters. Scaling for both axis are automatic and auto-scaling. This means that as more values are processed the scaling will change and become normalized based on the values themselves.
To examine a specific set of counter values received at a given time, simply mouse over the time period.
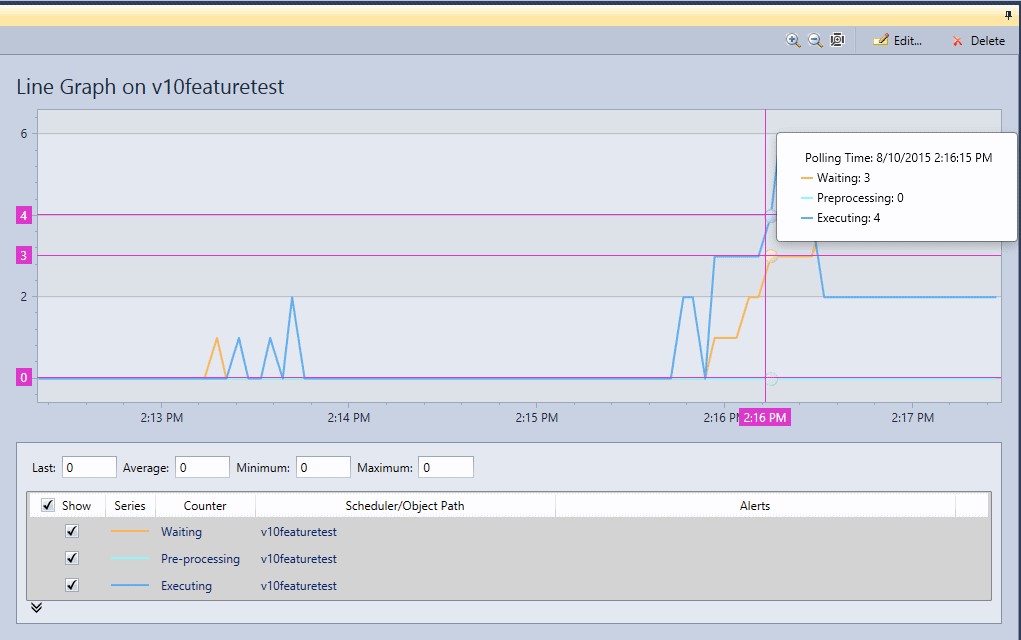
The box that appears displays the counters and their values at that specific time.
Each graph provides a collapsible area that holds the counters being displayed. Each counters attributes are shown on a single line. The “Show” checkbox allows you to hide or show the graphed counter. This allows you to isolate a specific counter and/or compare a smaller set of counters while still gathering information on the entire set of counters you specified.
The upper right-most section of the graph element allows you to zoom in/out, edit or delete the graph. Finally the rightmost corner allows you to pin a graph to a dashboard and keep it present.
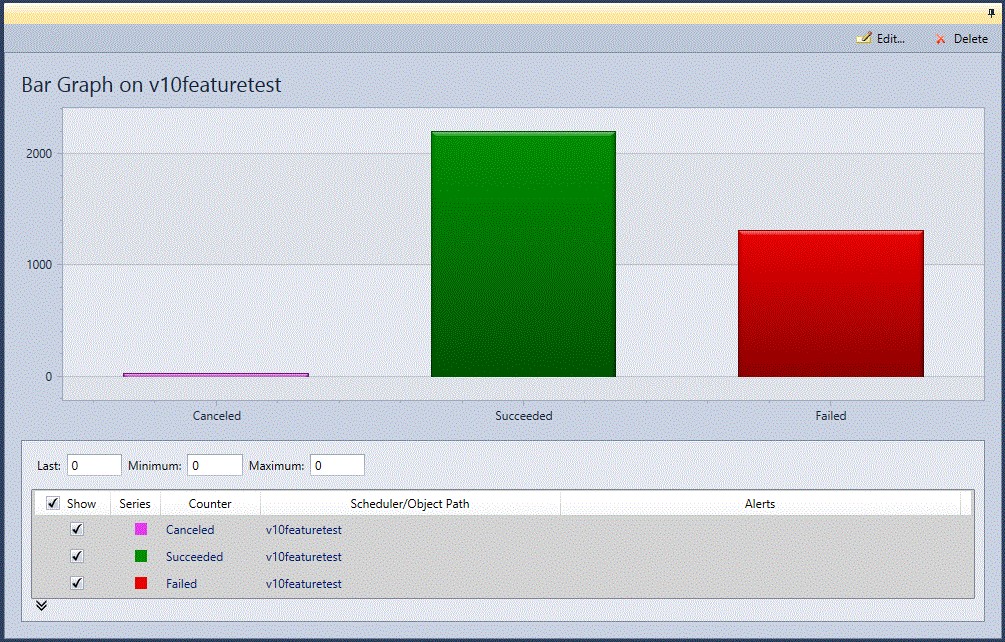
The Bar graph is most suitable for displaying historical counters such as the various completed counters shown. To see the actual values simply mouse over each counter.
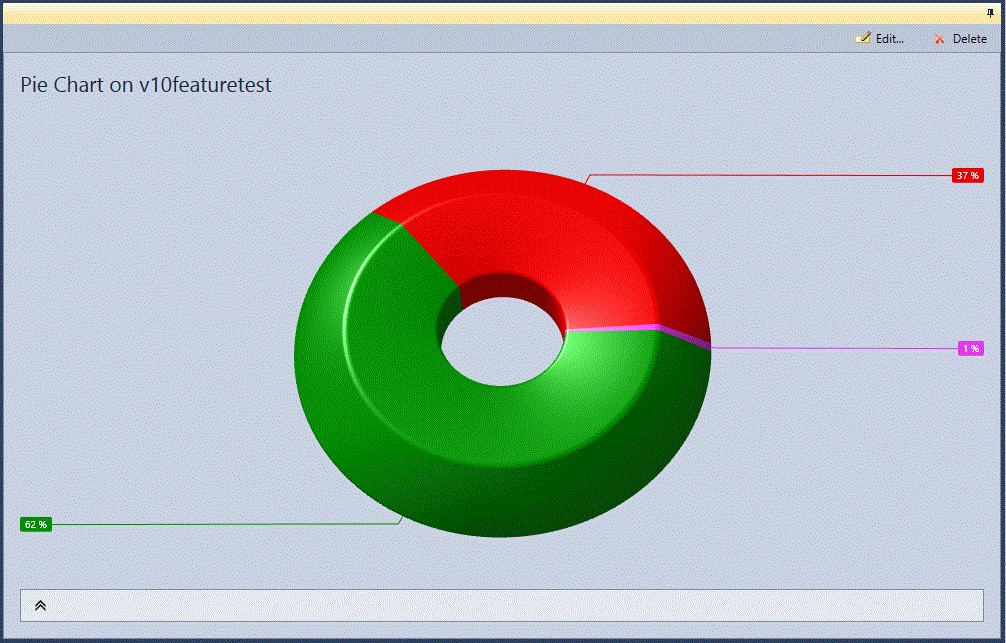
The above figure is a 3D Pie Chart. This graph like the Bar graph is mostly suitable for Historical counters. You can rotate the 3D Pie Chart using the “hand” cursor that will automatically appear.
Alerts
The ActiveBatch Dashboard supports user-level alert settings. This means that, for operational counters, you can set one or two values per counter, which when reached will provide a visual alert. The alert is a simple message notification indicating that a given counter reached a given alert level. The alert levels are classified as warning and critical. The alerts are purely for Dashboard notification and do not have any relationship to the ActiveBatch Alerts facility.
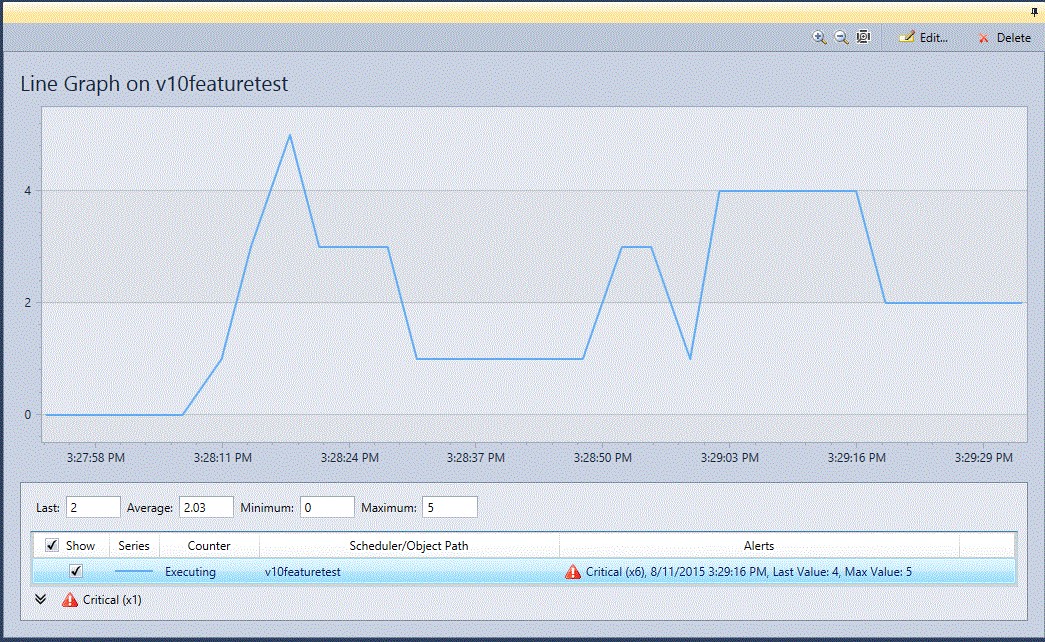
The figure above is a Line graph with a single counter of Executing Jobs and a critical alert level of 5. This means that when the value for “Executing” meets or exceeds 5 a critical alert is noted. You can see that the notification takes 2 forms: first, on the expand/collapse line of the details/counters area and second, on the counter itself. The detailed alert indicates that the “critical” alert occurred 6 times (x6) and provides the date/time and “last value” and “max value” encountered.
When an alert is raised, you must acknowledge the alert to reset. This can be done in 2 ways. First, by right-clicking on the alert itself and selecting “acknowledge”. Second, is to right-click on the expand/collapse bar and select “acknowledge critical”, “acknowledge warning” and “acknowledge all” as appropriate. This avoids you from having to select and acknowledge each alert individually.
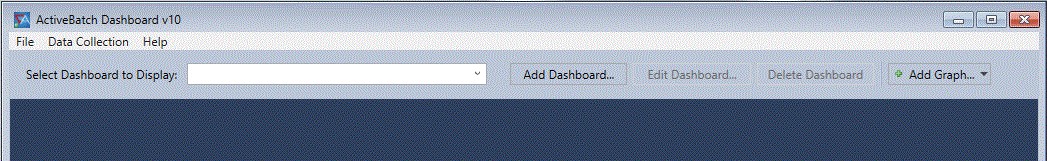
Dashboard Operations
Once you’ve created a dashboard (either implicitly or explicitly) you can perform various operations on that dashboard.

If you have more than one dashboard you can use the “Select Dashboard…” control and the dropdown handle to select another dashboard.
The Add Dashboard button allows you to add a new dashboard. Dashboards must be uniquely named.
The Edit Dashboard button allows you to rename an existing dashboard.
The Delete Dashboard button allows you to delete an existing dashboard. A confirmation message appears requesting confirmation before the dashboard is deleted.
The Add Graph button allows you to add a new graph to an existing and selected dashboard.
Data Collection
The ActiveBatch Dashboard collects counter statistics and displays them graphically. Sometimes you may want to save those counters over a specific time to show others what you are seeing and/or to diagnose or troubleshoot some issue you are encountering. That’s the purpose behind Data Collection. With Data Collection you can specify a starting and ending time for the collection period. The information will be stored in a file that you can later access.
Start Data Collection
To begin a Data Collection, select Start Data Collection from the menu bar under Data Collection.
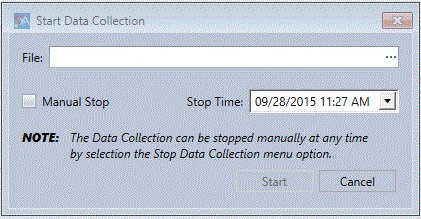
The above dialog requests a file specification for storing the data collected. In addition, you need to specify whether you want to manually stop the collection or for the collection to stop at a specific date/time. Regardless of the selection you can always decide to stop the collection manually.
Note: When a Data Collection is active, you will be enable to create and/or manage any dashboards other than the current dashboard. In addition, while you can create new graphs you will be unable to delete any graphs that would essentially interfere with the active data collection process. These restrictions disappear when the data collection is stopped.
Stop Data Collection
To stop an active Data Collection, select Stop Data Collection from the menu bar under Data Collection.
Open Data Collection File
To open an existing Data Collection file, select File from the menu bar and then Open Data Collection File. You will then be asked to select the file to be opened. When a Data Collection is opened, the only graphs available are those that are time based. Since the Data Collection process captures all the counters you can add counters to your graph even though, at the time, you hadn’t mapped to those counters.
ActiveBatch Dashboard Operations
The ActiveBatch Dashboard utility allows you to save your configuration as well as the counters you’re tracking. Two (2) menu bar categories are available (besides Help): File and Data Collection.
File Operations
The following operations may be performed:
Open – Open a Dashboard Configuration file. The Dashboard configuration file contains all your dashboard and graph elements and layout. Advanced JSS connection credentials are not stored and you will be prompted for those credentials if used.
Settings – This operation allows you to set the Polling Interval (default is 30 seconds; minimum is 15) and the Retry Timeout (in minutes) if a scheduler connection fails. The default Retry Timeout is 2 minutes. You can also set the Historical Counter value to Daily or Aggregate.
Save/Save As – This operation allows you to save the dashboard configuration and/or save and name the file.
Print – This operation allows you to print a dashboard.