Forecast
Forecast combines the best aspects of the Gantt Chart to depict the impact that one workflow (or batch) can have on another dependent workflow. The impact can be seen or read in terms of the latest start and end time a specific workflow can have before it adversely affects the running of a dependent workflow.
Forecast then provides insight in terms of when a particular batch within a much larger related workflow needs to start and/or end before it impacts later scheduled batches. Forecast analyzes the dependencies (objects that have constraints configured) between related batches to produce a critical path for determining adverse effects for other downstream batches. Once that analysis is complete, a picture can be displayed that presents those batches as a single related workflow. Operations can then gain insight into the run-time requirements for each batch as it relates back to the workflow.
Forecast shows related workflows on one line with their expected starting, ending times and duration. You can drill into a related set of batches to see each individual batch and then drill in to see the individual members of the batch ala Gantt. By default, Forecast looks at the present and next day. As time goes by, the Forecast becomes more accurate since previous workflows complete with actual starting and ending times (and status).
Let’s use the example of three (3) groups of batches that have dependencies that essentially form a long workflow. We have three (3) batches named Morning, AM1015 and AM1020; two (2) batches named Afternoon and PM1300 which are dependent on the earlier morning batches to complete successfully before executing and then lastly two (2) evening batches named Evening and Nite7pm which are dependent on the afternoon batches completing successfully.
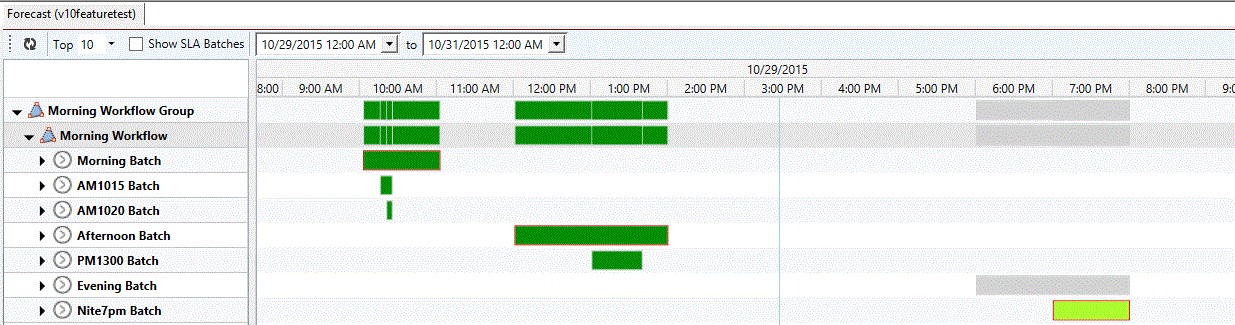
The figure above visually illustrates the batches and their relationships. In particular, note the first row named “Morning Workflow Group” and the row beneath named “Morning Workflow”. That row shows by time of day and expected duration a union of the batches for the workflow. The bars in green indicate the batches that have already run successfully. The bar in grey indicates a future batch(es) which have yet to execute. As you can see by the spaces in the row, none of the batches ran too long and/or failed to run so as to cause an impact to a future batch or portion of the overall workflow.
When we expand the “Morning Workflow” you can see the underlying batches that comprise the entire workflow. You may have noted an orange box around some of the batches. The orange box highlight is meant to visually depict the critical path of the workflow. The critical path is the longest path, comprised of dependent batches, of this workflow. When the forecast is composed of entirely future batches, the critical path is calculated and will never change (unless, of course, someone changes something in the Plans/Jobs themselves). When the forecast consists of actual executing batches, the critical path may indeed change depending on the results between the forecast and what is actually happening. Just as Forecast depicts the critical path, Forecast is also capable of indicating what the earliest and latest start and end times for any particular batch must be so as to not impact the start and end times of any future batch. This information is provided by hovering over any of the batches.