Scheduling Analytics
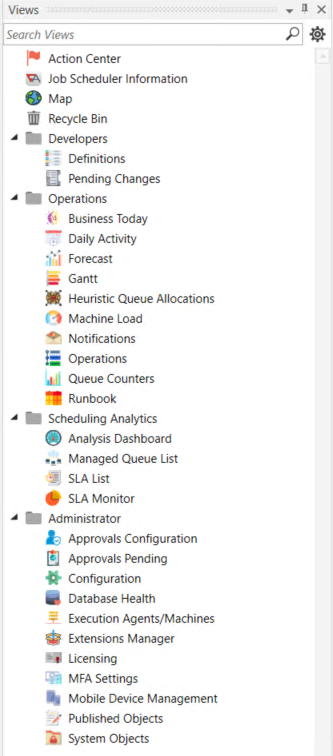
By default, (4) views are grouped together in the Scheduling Analytics folder located in the Views pane (see the image below). This includes the Analysis Dashboard, Managed Queue List, SLA List, and SLA Monitor. They are described in this section. But, as a quick summary, see below:
-
The Analysis Dashboard provides access to OLAP generated dashboards and instance reports for easy display and analysis.
-
The Managed Queue List provides a list of Managed Queues and a summary of their properties.
-
Managed Queue supports automated provisioning of cloud and/or virtual machine systems based on real-time and/or historical demand. Managed Queue requires an additional ActiveBatch license.
-
-
The SLA List provides a list of objects marked as SLA-sensitive, and a summary of their properties.
-
Availability SLA's are supported which specifically deals with the time-criticality imposed on a Job or workflow. This time critical aspect of a workflow is typically expressed as a deadline. In other words, the workflow must complete successfully by 1pm
-
-
The SLA monitor view provides real-time information concerning Plans and Jobs marked as SLA sensitive.
The Views pane, depicted in the image below, is configurable by accessing Tools > Settings > Views > General. You can optionally makes changes to Views layout to suit your preferences. For example, you can move view(s) into a different folder, create your own folders, and hide views or folders. You can also reorder the views within their respective folders. If you are satisfied with the factory default layout, you can keep the Views pane as-is.
If your Views pane does not look like the image below, it is because the factory default layout has been customized using the Settings option mentioned above. The content in the Views pane is documented to match the factory default layout you see in the image below.