SLA Monitor
This view provides real-time information concerning Plans and Jobs marked as SLA sensitive. The SLA designation means that this Plan or Job is time sensitive and/or critical to your enterprise. This view allows you to chart the progress of these objects and be in a position to determine whether they will achieve their deadline.
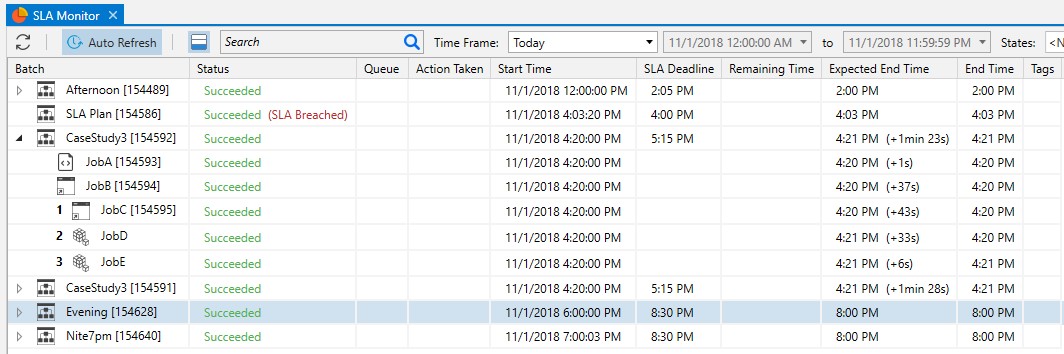
The SLA Monitor view is Operations focused and allows specific attention to SLA-marked objects with emphasis on providing insight towards whether the SLA is expected to be met or breached. Each batch is displayed that is either currently executing or recently completed. Using a simple tree orientation, the Plan (if any) and any underlying objects are displayed in Critical Path (CP) order. The ordering itself using a simple numbering scheme beginning with 1 and increasing to the last object in the CP. This Critical Path is recalculated as the batch executes. This means the path may change as underlying objects wait or run longer than expected. Most columns are self-explanatory or have been previously discussed in other views. The following columns are specific to the SLA Monitor.
Action Taken indicates those actions taken (if any) by ActiveBatch to avoid an SLA breach. For example, increasing the OS priority or establishing a Queue Priority fence to get jobs executing.
Start Time is the actual instance creation of the batch (plan) itself or the underlying object of the batch.
SLA Deadline is either the absolute deadline when expressed as just a time or a computed deadline when shown with an (RD) suffix. This time denotes when the SLA marked object must complete successfully by.
Remaining Time provides an easy to read countdown timer that represents how close the batch or job is to breaching. Expected End Time is the expected end time when the batch or underlying objects are executing. Once completed the end time becomes reported as the actual end time. A notation of any increase or decrease in expected run time is shown within parenthesis.
The third icon from the left allows you to obtain a graphical timeline of a selected plan/job row.
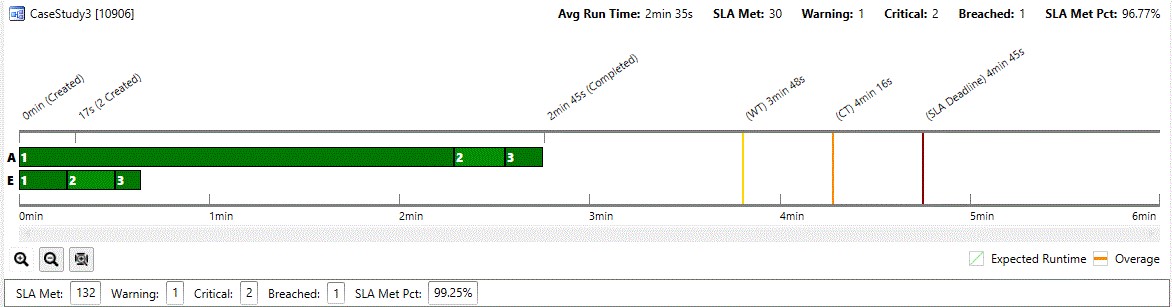
The bottom half shows the critical path and related workflows for those SLA marked Plans and Jobs. The example above shows a completed batch. Two progress bars are shown. The first marked with an “A” is the actual instance as it executes and completes. In this example, all the instances completed successfully. The second line marked with an “E” is the expected run-times for each underlying object. The intent is to compare the expected progress with the actual progress. Each specific instance is ordered using the same numbering system and in direct relation to the Upper portion of the view. When multiple instances are executing and it isn’t clear which will become the object on the critical path the designation (“n” Created) is shown. That was the situation above with object 1. Colored lines are using to denote Warning and Critical alert levels (where applicable) followed by the red line to denote the SLA Deadline. The scale for the progress bars is time and can be changed by zooming in/out or to-fit. All times shown are relative to the start of the batch and the SLA deadline.
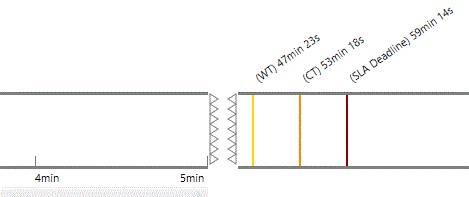
When the SLA Deadline is far enough in the future to cause the time scale to become useless, ActiveBatch employs a split grid time scale. Note that to the left of the jagged edge of the timeline, the scale is in minutes. To the right, the scale is changed to properly depict the warning(s) and deadline. When a split grid is used, the horizontal scroll is only applicable to the left portion since the right portion is statically locked.
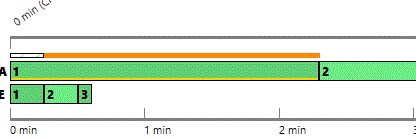
When a specific job is selected (as opposed to the entire batch) additional information is displayed. In the figure to the right, JobA (order number 1) has been selected. A specific notation bar appears. The white thatched area shows the expected run time and the orange portion shows the actual run-time (which is longer). This allows you to more easily compare expected vs. actual run times in the progress bar.
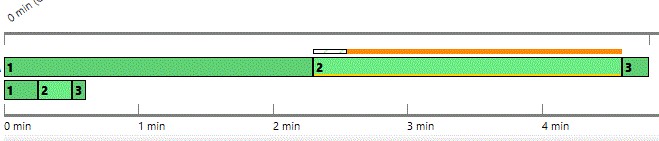
This is better illustrated by selecting the second job of the critical path.
For convenience each half supports right-click level context sensitive operations at the instance level. This means you can pause, resume, abort, view instance properties as well as other operations without having to resort to other views.