View Instance History
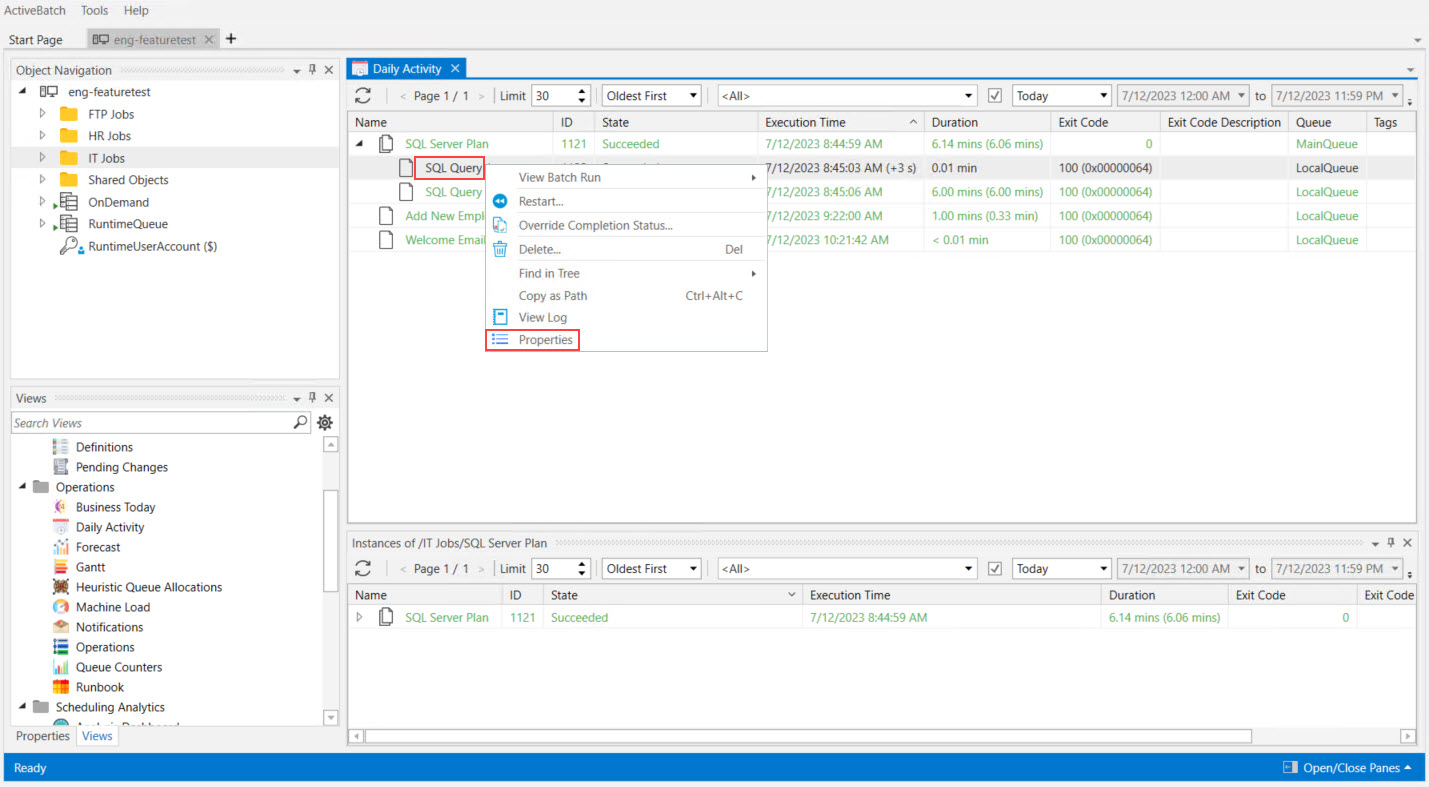
Every instance generated has extensive instance history. This can be helpful for informational and trouble shooting purposes. To view instance history, access an instance view (e.g. Instances, Daily Activity, Operations, Runbook, etc.), select an instance, right-click, then select Properties - as depicted in the image below.
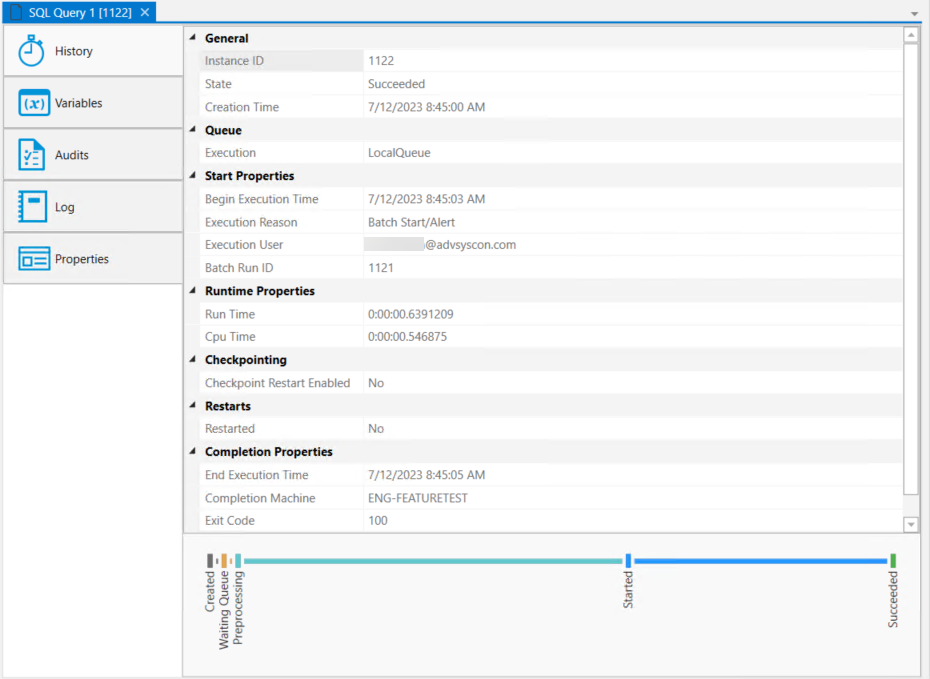
After selecting properties for the Job depicted in the image above, the properties for the instance will be tabbed in the Main view, as depicted in the image below. The History tab is active by default.
Note: The Instance Details Pane also provides instance properties that include the Job log file, audits (instance time line) and variables.
Expand the desired topic below to learn about a specific Instance Properties category.
The History tab provides most of the information you would need concerning the running or completed Job. Information is broken down into categories that can be collapsed or expanded as necessary.
General Properties: This list displays current state information.
-
Instance ID: The unique, system-assigned Instance ID.
-
State Details: Additional information concerning the state of the Job (if applicable).
-
State: The current state of the instance. The state line is color coded to also visually indicate the state of the instance.
-
Creation Time: The time the instance was created.
Queue:
-
Execution Queue: The name of the Execution Queue the Job ran on.
-
Original Submission Queue: The name of the original Submission Queue (for example, a Generic Queue).
Start Properties: This list displays various startup information about the instance.
-
Begin Execution Time: The date and time the Job began execution.
-
Execution Reason: Why the Job began execution. For example, Date/Time would mean it was a scheduled trigger.
-
Execution User: The user under whose security context the Job is run.
-
Batch Run ID: This is the ID associated with a related stream of Plans/Jobs. For example, if a Plan is triggered for execution, that Plan and all nested Jobs/Plans will have the same Batch Run ID.
Runtime Properties:
-
Actual Run Time: Actual elapsed time of the Job.
-
Actual CPU Time: Actual CPU time of the Job.
Checkpoint Properties:
-
Checkpoint Restart Enabled: This property indicates whether a checkpoint was taken. If one was, the date and time of the last checkpoint and thirty (30) characters of the checkpoint would be displayed.
Restarts:
-
Restarted: This property indicates whether a restart was ever performed. If one was, the date and time of the last restart and total number of restarts would also be displayed.
Completion Properties:
-
End Execution Time: The date and time the Job completed execution.
-
Completion Machine: The name of the last machine that ran the Job.
-
Completion Status: SUCCESS, FAILURE or ABORTED indication for the Job.
-
Exit Code: This field contains the actual Job exit code (decimal).
-
Exit Description: Unless the property “Interpret Exit Code” is disabled, ActiveBatch attempts to interpret the “Job return code” as an NT Message Code (so you may need to ignore this field).
Graphical Time Layout:
-
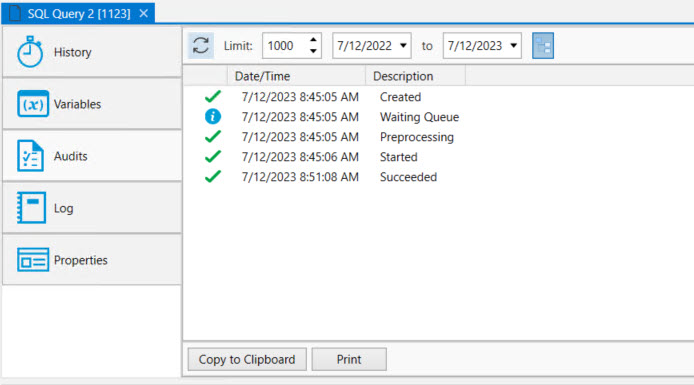
Beginning with “Created” and ending with the completion state (Successful, Failed or Aborted), this view displays a time line of the instance states and a relative view towards how long each state lasted.
-
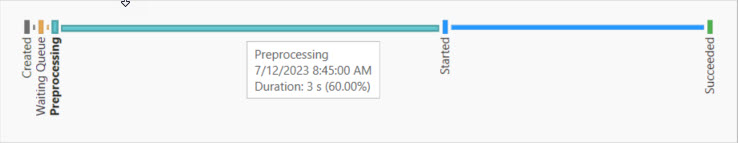
Hovering over a time line state provides more information concerning that state. For example, the Preprocessing state is responsible for around 50% of the processing time for this instance, as per the above image (note that Preprocessing also includes dispatch and startup of the Job itself on an Execution Agent - this is under-the-hood work done by the Scheduler). The Preprocessing duration was 3 seconds while the total duration was 6 seconds. If no duration is provided, then the time spent was less than a second. By examining the “Waiting” times you can gain insight into improvements that can be made on the ActiveBatch side of the workflow.
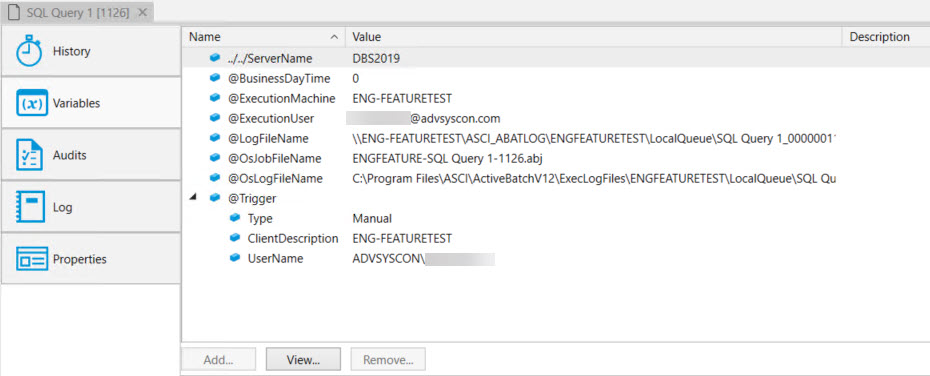
The Variables tab displays all the variables and values assigned to each variable for any selected Job or Plan instance. This avoids guesswork or special tracing to determine what a particular variable was set to. If a variable fails to resolve, it may cause the Job to fail. Checking how the variables resolved may offer a clue when troubleshooting failed Jobs.
When a variable is displayed with an expand/collapse icon to the left of its name, that means that the variable represents a structure. You can expand or collapse the structure by clicking on the icon. In the image below, the @Trigger variable represents a structure that is currently expanded. To view a variable more fully, either double-click on the desired variable or select the variable, then click the View button. The Add and Remove buttons are disabled for this read-only view.
The Audits tab displays all the ActiveBatch audits that the instance generated. Audits are generated by the Job Scheduler as it steps through the process of creating an instance and dispatching it an Execution Agent. Audits should be examined when you have a question concerning why a Plan or Job ran (or didn’t run).
The Audit's toolbar (from left to right) allows you to refresh the view, set a limit to the number of audits displayed, set a date range, and group related audits together.
The Job log file produced is the traditional log file that contains text output of the Job. The Log tab lets you see the output log of the Job (if logging is enabled). The log file captures output and errors, if any. It also includes ActiveBatch statistics (this can be disabled). It is typically common to check the Job log file first, if a Job fails, because that is where errors are recorded. In addition, you may see a reason for Job failure described in the Exit Code Description column of the various Instances views.
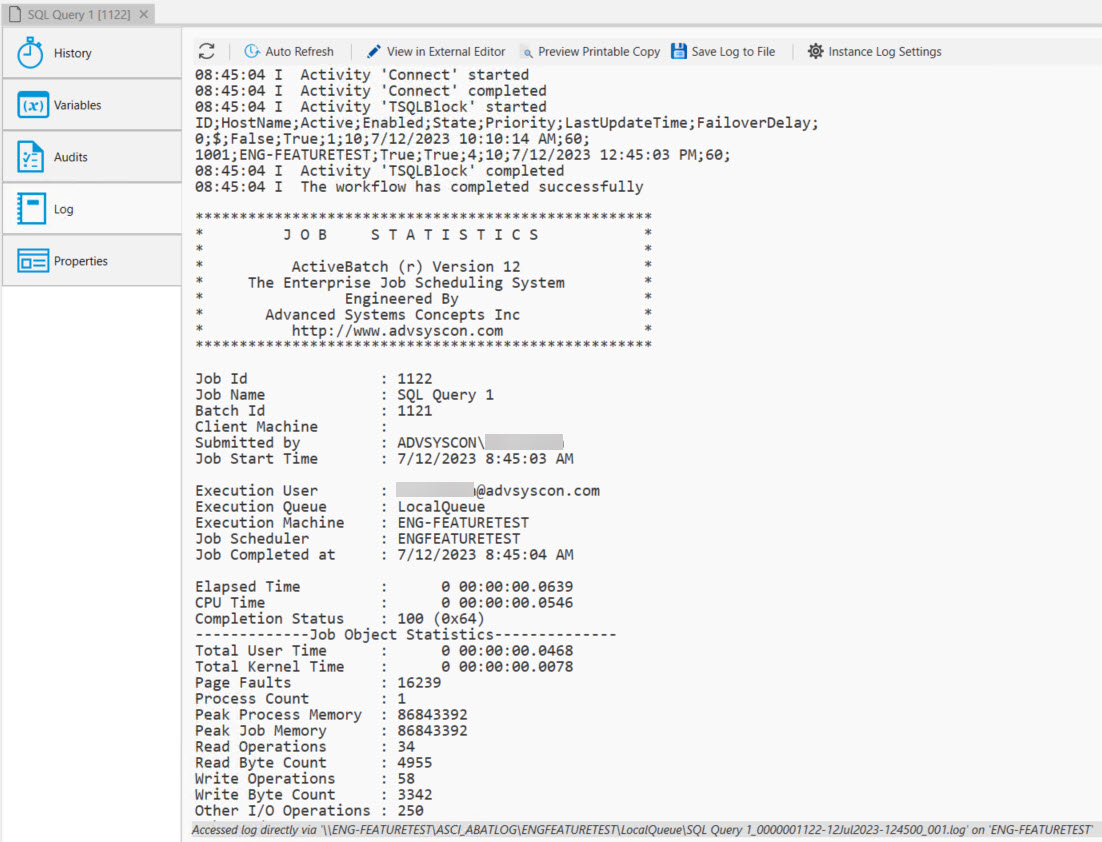
Above is an image of a sample Job log file. Logging can be disabled on a per Job basis or via a Default Job Policy![]() . This is mentioned in the event there is no Job log file created for a failed instance. Other reasons for lack of a Job log file include: the log file was purged, or a log file was not created because the Job did not get far enough into the executing phase to generate one. For example, if the user credentials associated with a Job does not authenticate on the Execution Agent system, the Job will fail with a Logon error, and no Job log file will be generated. If logging is disabled, it is done on the Execution tab of a Job's property sheets. The Logging checkbox must be enabled for a log file to be generated. By default, the logging feature is enabled for all new Jobs. It is recommended that logging remains enabled, as it is a key source of information when troubleshooting a failed Job.
. This is mentioned in the event there is no Job log file created for a failed instance. Other reasons for lack of a Job log file include: the log file was purged, or a log file was not created because the Job did not get far enough into the executing phase to generate one. For example, if the user credentials associated with a Job does not authenticate on the Execution Agent system, the Job will fail with a Logon error, and no Job log file will be generated. If logging is disabled, it is done on the Execution tab of a Job's property sheets. The Logging checkbox must be enabled for a log file to be generated. By default, the logging feature is enabled for all new Jobs. It is recommended that logging remains enabled, as it is a key source of information when troubleshooting a failed Job.
If the log is small enough you can see the information in the window provided (1 megabyte is the maximum size that can be displayed in the window). Otherwise you’ll need to view the log file via the View in Editor button. The log file on a remote machine can only be displayed if it is accessible. ActiveBatch uses two (2) methods for retrieving a log file. First, the log file is accessed through an ActiveBatch (Windows) share that is created at installation time. If this approach does not work (for example, the log is on a Unix system), ActiveBatch will retrieve the file through the Execution Agent on the remote machine. The bottom portion of the Log file view indicates how the log file was accessed (see the last line in the above image). In this example, the file was accessed through the Windows share (\\ENG-FEATURETEST\ASCI_ABATLOG\ENGFEATURETEST\LocalQueue\SQL Query 1_0000001122-12Jul2023-124500_001.log)
If an error occurs when accessing the file via the Windows UNC share, the destination computer where the log file resides can be placed on a UNC exclusion list. You can manage the UNC Exclusion List through Settings (see Tools > Settings > Views > Instance Log > UNC Exclusion List). This list is for you, the individual console user and does not impact other users. When an Agent system is put on this list, the Scheduler only attempts to access the Job log file through the Agent. It bypasses the share.
When the file is accessed through the Execution Agent, a message will appear on the bottom portion of the log file, stating: "Accessed log via Execution Agent '<Agent System hostname>'". When the log file is accessed through the Agent, the user accessing the log must have Instance Control security permission granted on the Job definition. Instance control is not required when the file is accessed via UNC.
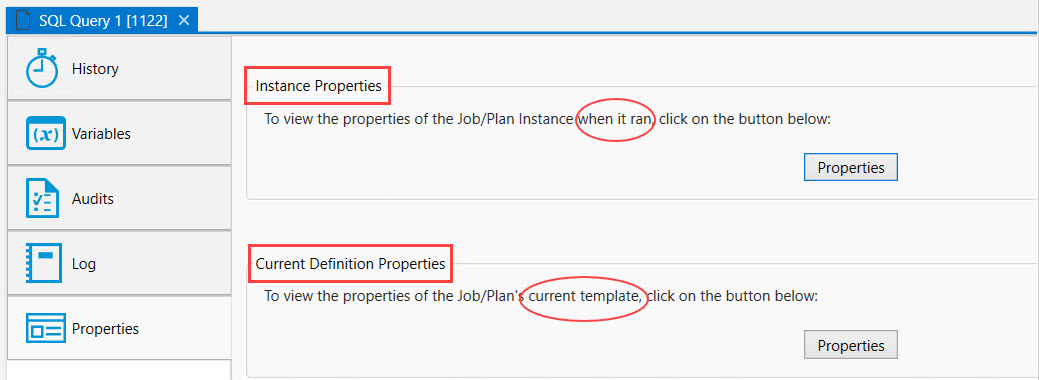
The Properties tab allows you to look at the Plan/Job Instance properties, or you can examine the current Plan/Job Definition. While both look similar - there is a very important difference. The Plan/Job Instance properties are a snapshot of the Plan/Job Definition taken when the instance was created (ideal for troubleshooting the instance if it failed - you can see how the properties were set at the time the instance was created). The current Plan/Job Definition is what the definition looks like right now, which could be different than when the instance was created. If you have modify rights to the Job and you access the current definition properties, you could potentially make property change(s) and save them. It would be similar to accessing the object properties using the Object Navigation pane.