Instances Pane
This pane allows you to see all the instances for a selected Job, Plan or Queue. The Instances pane is updated when you select a Job, Plan or Queue (Execution or Generic) in the Object Navigation Pane. Selecting a Plan or Job instance in other views or panes that display instance data (i.e. Daily Activity, Operations, Gantt, etc.) and object data (e.g. Browse, Definitions, etc.) will also update the Instances pane with instances of the selected instance or object.
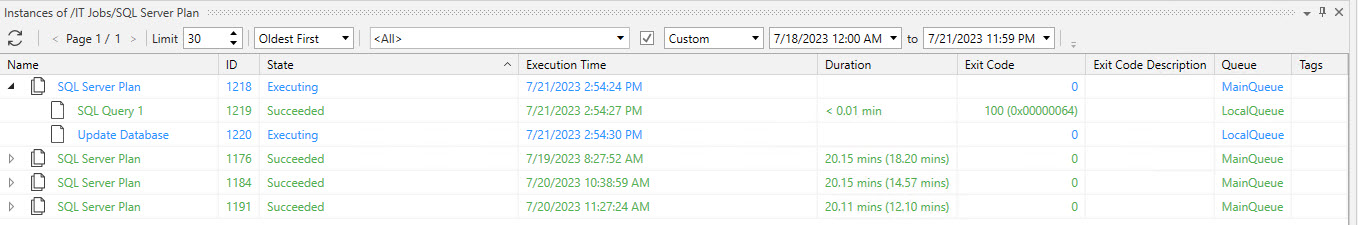
In the image below, all the instances of SQL Server Plan that meet the filter criteria are displayed. Notice the title bar includes the full path to the SQL Server Plan (/IT Jobs/SQL Server Plan). The first executing Plan instance has been expanded so you can see the 2 Jobs that are in the Plan. One Job has completed, another is still executing. Observe the Custom date filter is set, displaying all the instances that ran during the configured start date/time and end date/time. In the Date dropdown list (where Custom is currently selected), there are other canned options you can select from, like Today, or Last 2 hours, or Next 12 hours, etc.
Let's discuss in more detail what you see in the Instances pane, and what features are available.
Clicking on a column heading changes the sort order. Plans are represented by an icon that is slightly different than a Job, and Plans have the expand/collapse icon to the left of the Plan name. Use this icon to show or hide a Plan's contents. The instances are color-coded based on state. The State column displays an instance's state in text (e.g. succeeded, failed, executing, etc.). The color allows for you to easily identify instance states that need to be addressed, like red which indicates a failed Job, or purple which means a Job was aborted.
Each column is described as follows:
-
Name - The name of the Job/Plan.
-
ID - The unique Job/Plan instance number.
-
State - Current status of the Job/Plan. States fit into categories that include: not run (e.g. expected to run in the future), active or completed.
-
Execution Time - Depending on the state of the object, this.field for past and present instances reflects the actual execution time. For a future instance this field represents the expected execution time. In addition, a letter code indicates what trigger feature has been configured to generate the future runs for these instances. Depending on the scheduling features used, you may see an E, I or S. The E means an Expected event trigger has been configured. The I means an Interval schedule has been configured, and the S means a Schedule object is being used to generate trigger dates.
-
Duration - Depending on the state of the object, this field for past instances, reflects the actual elapsed time (duration) of the Job. If you see a time value in parenthesis, the value represents an under or over elapsed time based on the average run-time (if applicable). For present and future instances, the time value represents the expected (or average) elapsed time.
-
Exit Code - The Job/Plan’s exit code.
-
Exit Description -The interpreted exit code. (Note: Only ActiveBatch based exit codes are interpreted).
-
Queue - The name of the Queue this Job is currently on. Note: “MainQueue” is always associated with a Plan. Plan's don't get dispatched to Agents, only jobs do. MainQueue is for internal purposes and not accessible to users like Job queues are.
-
Tags - Tags associated with the object.
You can perform various operations on any of the Jobs or Plans displayed by right-clicking on the desired instance. This will result in a pop-up menu with context-sensitive options you can choose from. For example, if you right-click on an executing Job, the options you see will pertain to an executing instance and what is allowed in that scenario. Some options include aborting the Job, pausing it, changing its OS priority, and so on. See Instance Operations for more details.
Note: While the Instances pane will be updated when you click on a Generic Queue, the type of instance data you will see includes scheduled Jobs associated to the selected Generic Queue, but have not run yet. When a Job instance is dispatched to an Execution Queue that is a member of the selected Generic Queue, it will no longer appear in the Instances pane for the selected Generic Queue. Other data you may see when selecting a Generic Queue are instances that are associated to the selected Generic Queue, but never got dispatched to an Execution Queue. This scenario can occur if a Generic Queue was closed at the time of trigger. If a Generic Queue has been stopped, you may see instances in waiting state until they are dispatched to an Execution Queue.