Daily Activity
The Daily Activity list provides a dynamic, real-time display in a list layout of instances that have completed, are active (e.g. executing) and will run in the future. The information displayed provides a snapshot of what an ActiveBatch operator would normally need to see to manage and/or monitor Jobs. All triggerable objects (Jobs, Plans and Job/Plan References) are included in this view. There are filters that can be set to reduce the amount of data. By default, the current day's instance data is displayed (Today). This can be changed by setting the date filter. By default, instances in all states (executing, failed, succeeded, etc.) are displayed. This can be changed by setting the state filter. As an example, an ActiveBatch operator may start their day using this view to identify Job failures. The state filter can be set to only display failed Jobs. This de-clutters the view and allows the operator to focus their attention on Jobs that may need some troubleshooting to determine what went wrong.
Daily Activity displays all Jobs and Plans in ascending Execution Time order (although the display order can be changed by clicking on a column heading).
You can expand a Plan by clicking on the arrow at the start of the Plan row. This will display the Jobs that are part of the Plan. Instances are color-coded based on their current or completed state. For example, blue indicates an executing instance, green means the instance completely successfully, red means it failed, and purple means it was aborted (canceled). Additionally, gray instances depict future runs.
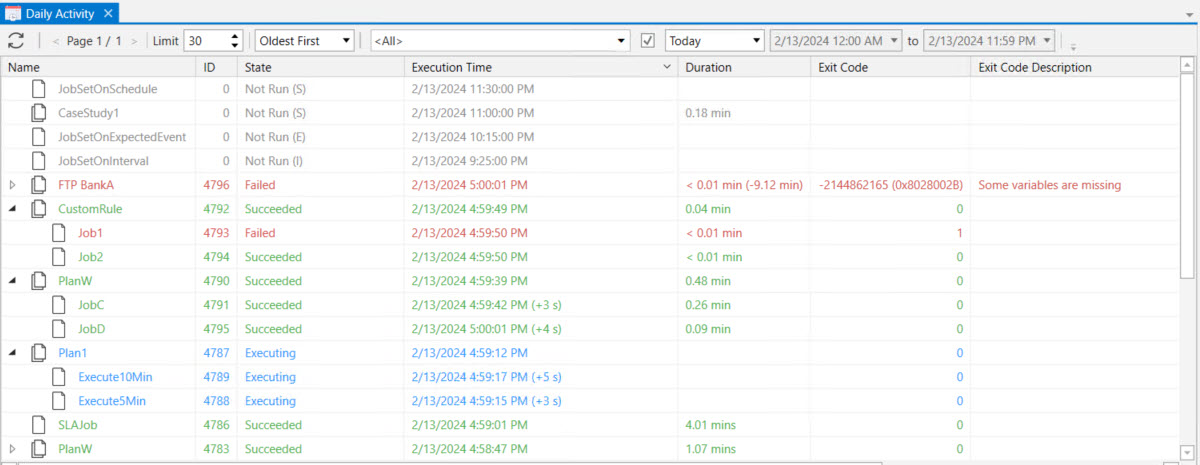
Each column in the Daily Activity list is described below.
-
Name - The name of the Job/Plan.
-
ID - The unique Job/Plan instance number.
-
State - Current status of the Job/Plan. States fit into categories that include: not run (e.g. expected to run in the future), active or completed.
-
Execution Time - Depending on the state of the object, this.field for past and present instances reflects the actual execution time. For a future instance this field represents the expected execution time. In addition, a letter code indicates what trigger feature has been configured to generate the future runs for these instances. Depending on the scheduling features used, you may see an E, I or S. The E means an Expected event trigger has been configured. The I means an Interval schedule has been configured, and the S means a Schedule object is being used to generate trigger dates.
-
Duration - Depending on the state of the object, this field for past instances, reflects the actual elapsed time (duration) of the Job. If you see a time value in parenthesis, the value represents an under or over elapsed time based on the average run-time (if applicable). For present and future instances, the time value represents the expected (or average) elapsed time.
-
Exit Code - The Job/Plan’s exit code.
-
Exit Description -The interpreted exit code. (Note: Only ActiveBatch based exit codes are interpreted).
-
Queue - The name of the Queue this Job is currently on. Note: “MainQueue” is always associated with a Plan. Plan's don't get dispatched to Agents, only jobs do. MainQueue is for internal purposes and not accessible to users like Job queues are.
-
Tags - Tags associated with the object.
Filter Bar

The filter bar allows you to more precisely target the specific instances you are interested in. The filtering is done when accessing the database, so you get quicker performance as well.
-
You must click the leftmost Refresh icon every time you set a filter.
-
The Limit field allows you to indicate how many instances should be retrieved immediately. When the number of instances exceeds the limit, the Page control allows you to move forward or backward through the collection of instance information.
-
The Ordering dropdown indicates whether you want to see the newest or the oldest instances listed first.
-
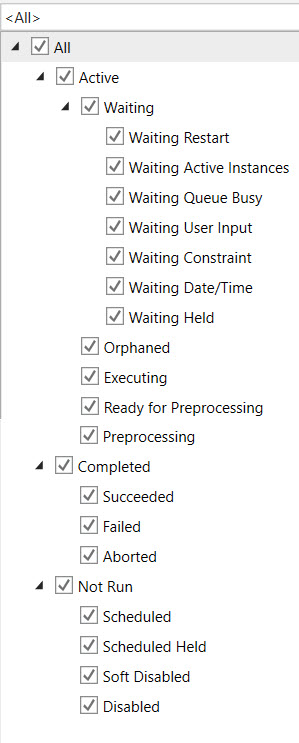
The Instance State dropdown filter allows you to specify the instance state(s) that you would like to see in the view. <All> is the default setting, as depicted in the image above. Below is an image of all the possible states you can filter by. For example, if you only wanted to see failed instances, click the Failed checkbox. You can click on one or more states.
The last series of filtering information is Date/Time oriented and must be enabled by clicking on the checkbox to the left of the filter. When the date/time filter is not checked, no date/time filter is applied when retrieving instance(s). The Date/Time dropdown allows you to select a canned filter option (e.g. Today), or enter your own date/time range for instance filtering. You must select Custom from the dropdown to enter your own date/time fields. The fields are disabled unless Custom is selected.
You can perform various operations on any of the Jobs or Plans displayed by right-clicking on the desired instance. This will result in a pop-up menu with context-sensitive options you can choose from. See Instance Operations for more details.
Daily Activity Aggregated
The Daily Activity Aggregated list is based on the Daily Activity list, but rather than displaying a single connected Job Scheduler's data (or Virtual Root![]() if using that feature), the aggregated view allows multiple Job Scheduler instance data to be displayed in a single homogenized view. The description of the features for this view are the same as described above, with two differences. The aggregated view includes a Job Scheduler column, identifying where Plans and Jobs reside (which Scheduler). There is also an additional filter for including or excluding Job Schedulers. Lastly, Daily Activity aggregated data is only depicted when using a feature called Job Scheduler Groups.
if using that feature), the aggregated view allows multiple Job Scheduler instance data to be displayed in a single homogenized view. The description of the features for this view are the same as described above, with two differences. The aggregated view includes a Job Scheduler column, identifying where Plans and Jobs reside (which Scheduler). There is also an additional filter for including or excluding Job Schedulers. Lastly, Daily Activity aggregated data is only depicted when using a feature called Job Scheduler Groups.